if (retryCount > MAX_RETRIES) {
 throw new Error('Backpressure limit exceeded');
}
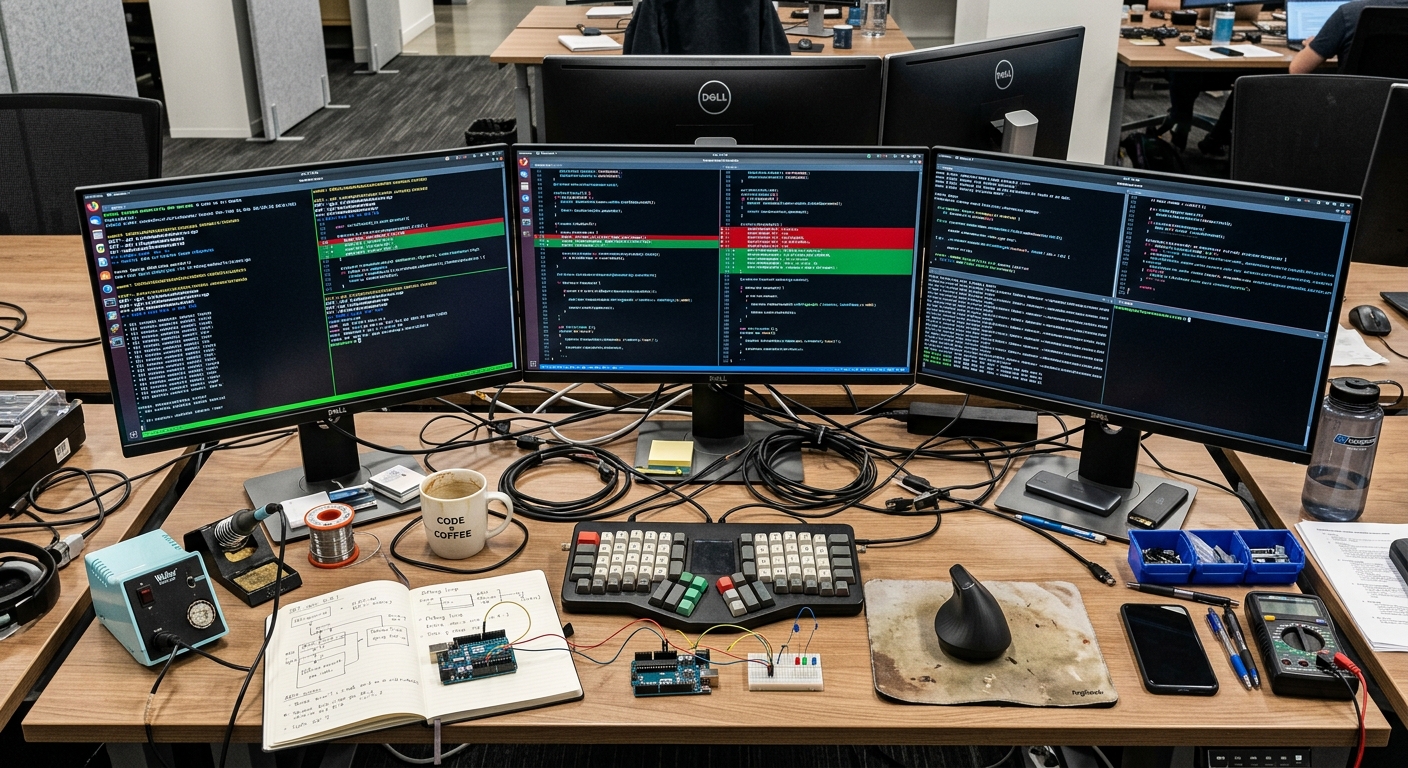
Last Tuesday, a minor configuration change to our connection pooler triggered a cascading failure. The service started dropping requests. The logs were a mess of timeout errors and socket hangs. In a situation like this, the instinct is to rollback immediately. But when the rollback itself is blocked by a flaky CI/CD pipeline, you need answers in seconds, not minutes.
I have seen plenty of marketing talk about how AI for debugging production incidents is going to replace engineers. It will not. If you treat an LLM like a senior engineer who can fix your infra, you will ship a regression that makes the initial incident look like a minor inconvenience. AI is not a debugger. It is a high speed pattern matcher. If you give it garbage context, it will give you a hallucinated fix that looks plausible but fails under load.
I use AI for one thing during an incident: reducing the time it takes to parse a 10MB log file and correlate it with a recent commit. This is about triage, not automation. You still own the ship. You still sign off on the fix.

What you will have at the end
By the end of this guide, you will have a structured workflow for using LLMs to isolate the root cause of a production failure. You will learn how to feed observability data into a model like Gemini to identify patterns you might have missed. You will also have a template for validating AI generated hypotheses in a sandbox before they ever touch your production environment. This is about moving from a chaotic 'guess and check' method to a data-driven triage process.
Prerequisites
Before you start throwing code at a prompt, you need a baseline. You cannot debug what you do not measure.
- Access to your observability stack. Whether you use Prometheus for metrics or Sentry for error tracking, you need the raw data. AI cannot 'see' your cluster. You have to provide the eyes.
- A large context window model. For production incidents, I use Gemini because its context window can handle massive log exports without truncating the very error message you need.
- A staging or sandbox environment. Never, under any circumstances, run a command suggested by an AI directly against your production database without testing it in an isolated environment first.
- A documentation hub. I use Notion AI to store our incident runbooks and previous post-mortem reports. This allows the AI to reference past failures that might be similar to the current one.
Step 1: Exporting context from observability tools
The biggest mistake people make is pasting a single error line into a chat box. A single line is useless. To get a real answer, you need the surrounding context. If you are dealing with a regression, you need the diff of the most recent deployment and the corresponding logs.
Start by grabbing the last 500 lines of logs from the failing service. If you are using a tool like Prometheus, grab the last 30 minutes of relevant metrics. You can find more information on standard metric formats in the Prometheus documentation.
I also recommend grabbing the output of your last successful build. If the service was healthy at 2:00 PM and started failing at 2:05 PM, the AI needs to see what changed in that window. Do not just provide the error. Provide the 'before' and 'after'. This helps the model identify if the issue is a code regression or an external dependency failure.
Step 2: Hypothesis generation with Gemini
Once you have your logs and your diff, it is time to generate a hypothesis. This is where you use a tool like Gemini. Because of its integration with various workspaces and its ability to ingest large files, it is well suited for this.
When you prompt the model, do not ask 'What is wrong?'. Ask 'Identify the three most likely causes for this increase in 500 errors based on the provided logs and the code diff'.
Here is a prompt structure that actually works:
'I am investigating a production incident. Below is the diff from the last deployment and a log export from the failing pod. Identify any mismatches between the new connection pooling logic and the error messages regarding socket timeouts. Look specifically for signs of backpressure or deadlocks.'
This forces the AI to look at specific architectural patterns. If you are struggling with how to integrate AI into your daily development without creating more problems, you might find our AI pair programming workflow guide useful. It covers the balance between speed and technical debt.

Step 3: Validating the fix in a sandbox
If the AI suggests a fix, for example, increasing the timeout on a database connection or adding a retry logic with exponential backoff, you must validate it. AI often suggests CLI flags that do not exist or library versions that are deprecated.
- Apply the suggested fix in your staging environment.
- Run a load test. You need to see if the fix holds up under the same pressure that killed the production instance.
- Check for side effects. Did the fix for the timeout cause a memory leak?
During this phase, keep your Notion AI open. Use it to search through your team's internal documentation to see if this 'fix' was tried before and rolled back for a specific reason. Often, what looks like a simple fix was avoided in the past because of a non obvious edge case. This prevents you from repeating the mistakes of previous on-call shifts. Dealing with this much information can be exhausting, which is a common symptom of AI tool fatigue.
Troubleshooting
AI for debugging production incidents is prone to several common failure modes. If the model is giving you generic advice like 'check your network connection', it usually means you have not provided enough specific context.
One common issue is the 'hallucinated library'. An LLM might suggest using a specific method from a library like axios or lodash that was removed three versions ago. Always cross reference suggestions with the official documentation. You can use resources like Sentry's error database to verify if an error code actually means what the AI says it means.
Another issue is the 'infinite loop' of debugging. You give the AI an error, it gives a fix, the fix causes a new error, you give that error to the AI, and it suggests the original code. If you find yourself in this loop, stop. The AI has reached the limit of its understanding of your specific system. At this point, you need to rely on manual tracing and observability. AI is a tool, not a replacement for your brain.
Next steps
Once the incident is resolved and you have shipped the fix, the work is not done. The true value of AI in the incident lifecycle happens during the post-mortem.
- Use the LLM to summarize the incident timeline based on Slack logs and PagerDuty alerts.
- Feed the root cause back into your documentation so the AI can find it next time.
- Evaluate your feature flags. Could this incident have been mitigated by a faster toggle instead of a full rollback?
Debugging is a high stakes game. AI can help you sort through the noise, but you are the one who has to pull the trigger on the ship. Use it to gain clarity, not to avoid responsibility. If you want to see how data can drive these post-incident decisions, check out this post-mortem case study. It breaks down the costs and technical failures of a real launch in a way that avoids the usual marketing fluff.